Seattle crime map
Seattle has 68,497 police-reported incidents in the stored dataset, with a newest record dated 2026-11-04. Source: data.seattle.gov. These are recorded reports rather than convictions or predictions of personal risk. Review the stated coverage and licence before interpreting counts or comparing locations.
Last updated: 2026-11-07
Reported incidents are not a prediction of personal risk or a safe/unsafe verdict.
Reports on the grid
Approximately 500 m cells · north ↑
All recorded cells. Source area counts appear below the map.
Reading the grid
Each cell shows recorded reports in approximately 500 m of the city. Darker cells have higher counts; blank cells have no records.
Count quintiles (ties stay together): ≤ 7 > 7 to 17 > 17 to 30 > 30 to 65 > 65
Recorded reports by area
| Area | reports in the last 365 days |
|---|---|
| CAPITOL HILL | 4,309 |
| QUEEN ANNE | 3,360 |
| SLU/CASCADE | 2,807 |
| DOWNTOWN COMMERCIAL | 2,502 |
| NORTHGATE | 2,420 |
| UNIVERSITY | 2,315 |
| BALLARD SOUTH | 2,212 |
| FIRST HILL | 2,165 |
| ROOSEVELT/RAVENNA | 1,967 |
| BELLTOWN | 1,819 |
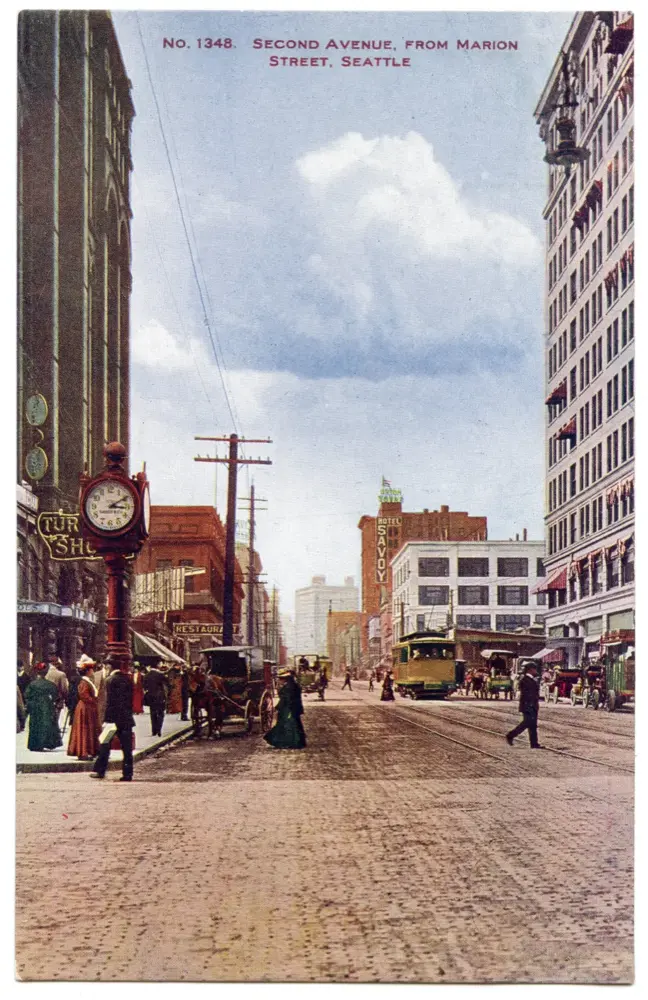
Picture: 2nd and Marion, Seattle, c1907 (8422182804) by Rob Ketcherside from Seattle, usa, CC BY 2.0, via Wikimedia Commons.
Window: Nov 2025 – Nov 2026. City facts, sources and methodology
What should I know about this data?
What is the source of these reports?
The source is data.seattle.gov. The listed licence is Public Domain.
Do reported incidents predict personal risk?
No. Reported incidents are not convictions, a prediction of personal risk or a safe/unsafe verdict.
How should I compare locations?
Review the data window and source coverage. Incident density scores compare locations within the same city and are not comparable across cities.
Where can I find related information?
Seattle crime facts · Seattle API coverage · Crime data API and pricing · Free crime data APIs compared · Crime API reference · Incident density methodology